
One of the things that I have seen really commonly, both in my own education and in the education of students I have observed, is that inability to get going on a task after it has been set. Sometimes this is due our minds being elsewhere, other times its because we have no idea what to do, and sometimes we just don’t know where to start. Fundamentally, the failure to start on a task is oftentimes because of cognitive load – the amount of “processing” our brains are doing – resulting in really inefficient thinking and doing. What if we could reduce cognitive load so students got going on tasks faster and easier?
A few years ago, the highway between my home and work was being upgraded. It was a slow and arduous journey a lot of the time, but because of the reduced speed (by that read parked at times!) I got to really look at the surroundings on a regular basis. I even made a time lapse video of part of my journey using Sam animation studio (its now called Hue).
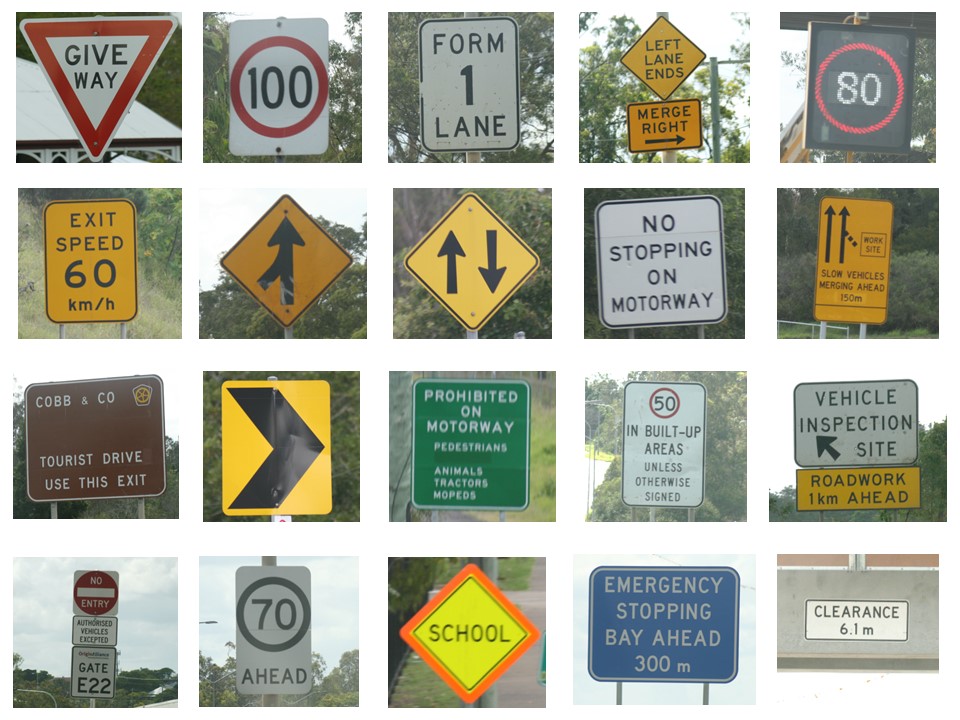
One of the things I noticed sitting in the traffic one day was the way authorities use very clear infographics, icons and signs to reduce the cognitive load on drivers – it really is a good thing if drivers can not have to think to much when they are driving! From the video above, I extracted just a few of the signs that I had to take in on my daily commute. What I found compelling was the fact that each sign gave a really specific instruction to the driver, that for the most part, was unambiguous and ensured that knew exactly what they should be doing.
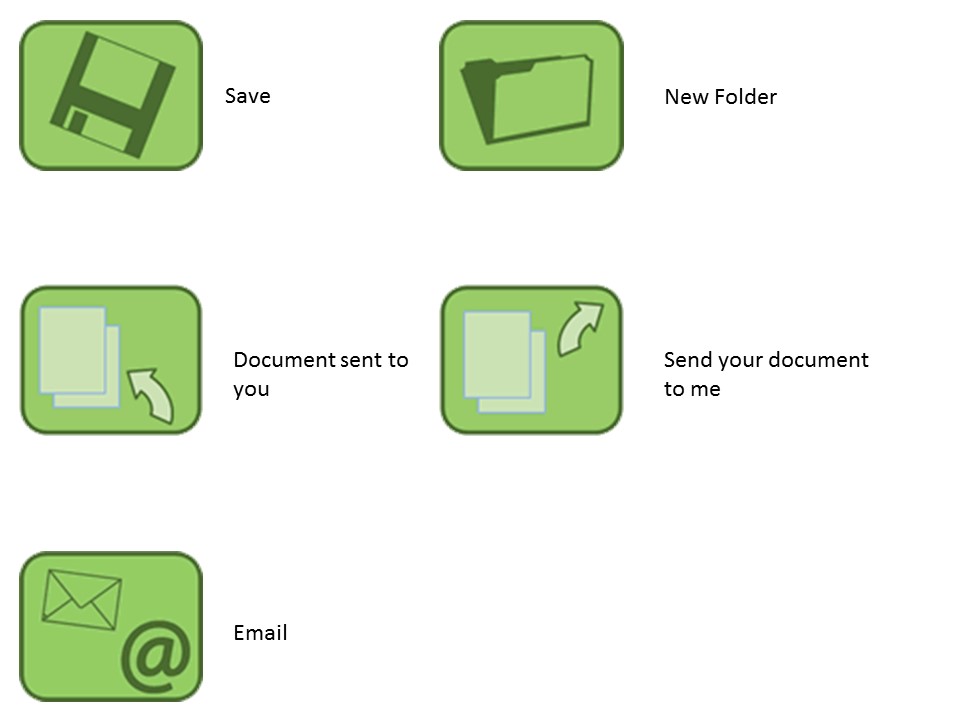
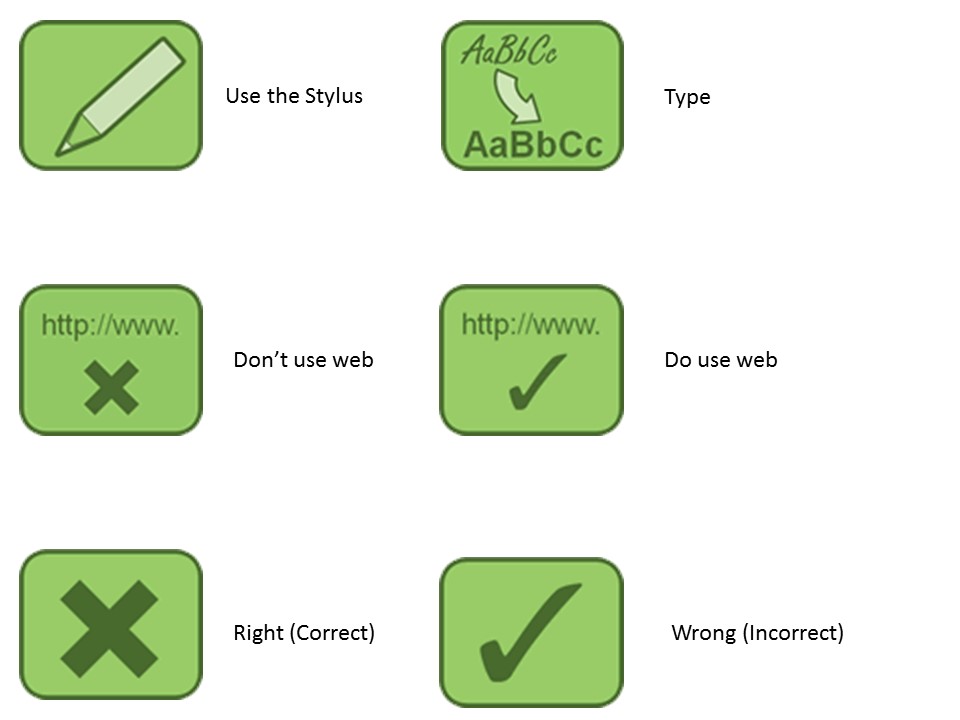
So I wondered what this would look like in education. Specifically in anything students had to interact with, such as instructions from a PowerPoint slide, a OneNote page for them to work on, or even a printed handout.. Here are the icons that I can up with (all made using PowerPoint and royalty free icon stock), and the description of what they mean for the students:

![]()
![]()
Now when I set student work, I often (but not always – I need the students to be able to decide how and when to start sometimes too) use these icons to reduce the cognitive load of students so they can just get started. And it works! It has also reduced the number of questions I get such as “do you want us to handwrite or type”. “Sir, should we make a table or a graph”. “Is this important?” (of course it is!).
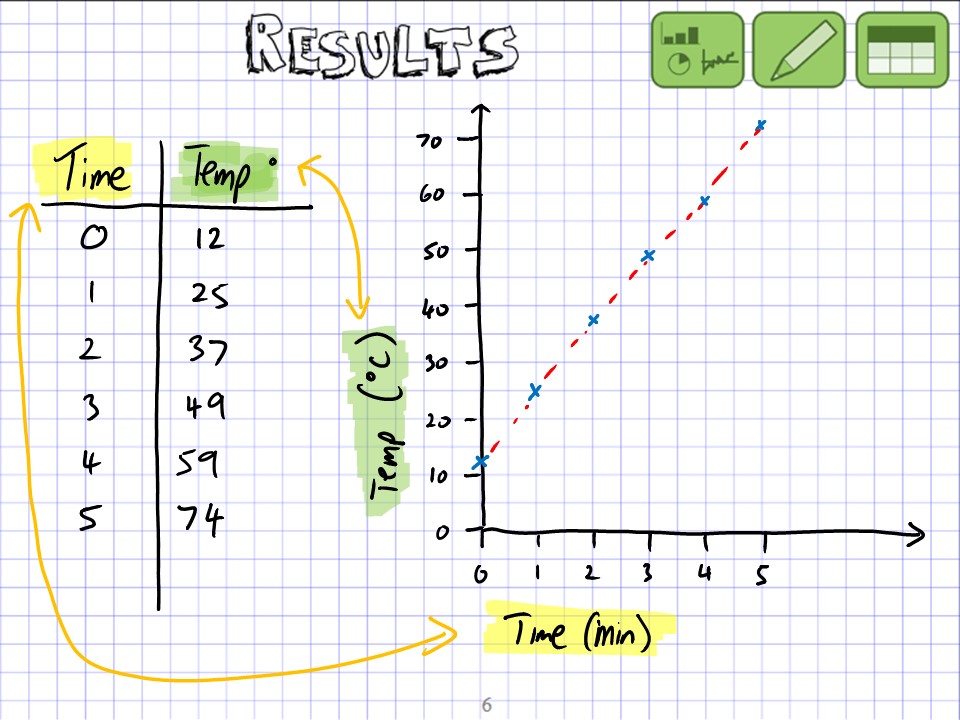
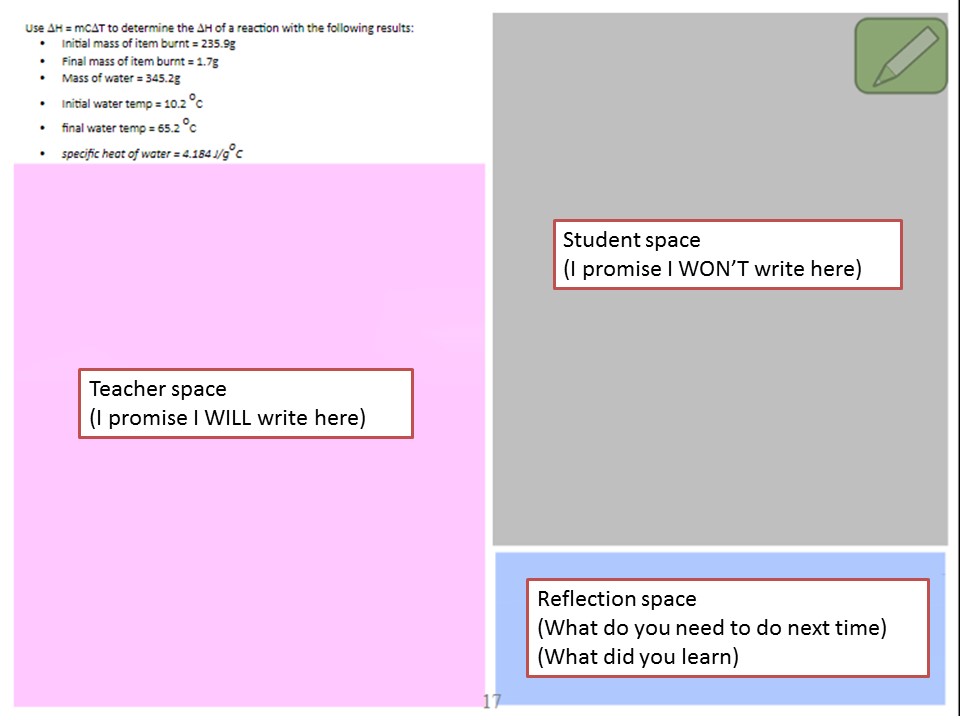
Another version of this is the use of defined zones within pages when multiple people will be working on a collaborative document – this is very much based on the green bike ways that we see on roads, or red bus ways. As drivers we know who and when should be on these areas.
In this example, you can see the students work which was done without support (and has an error), and my “correct” answer which was added after.
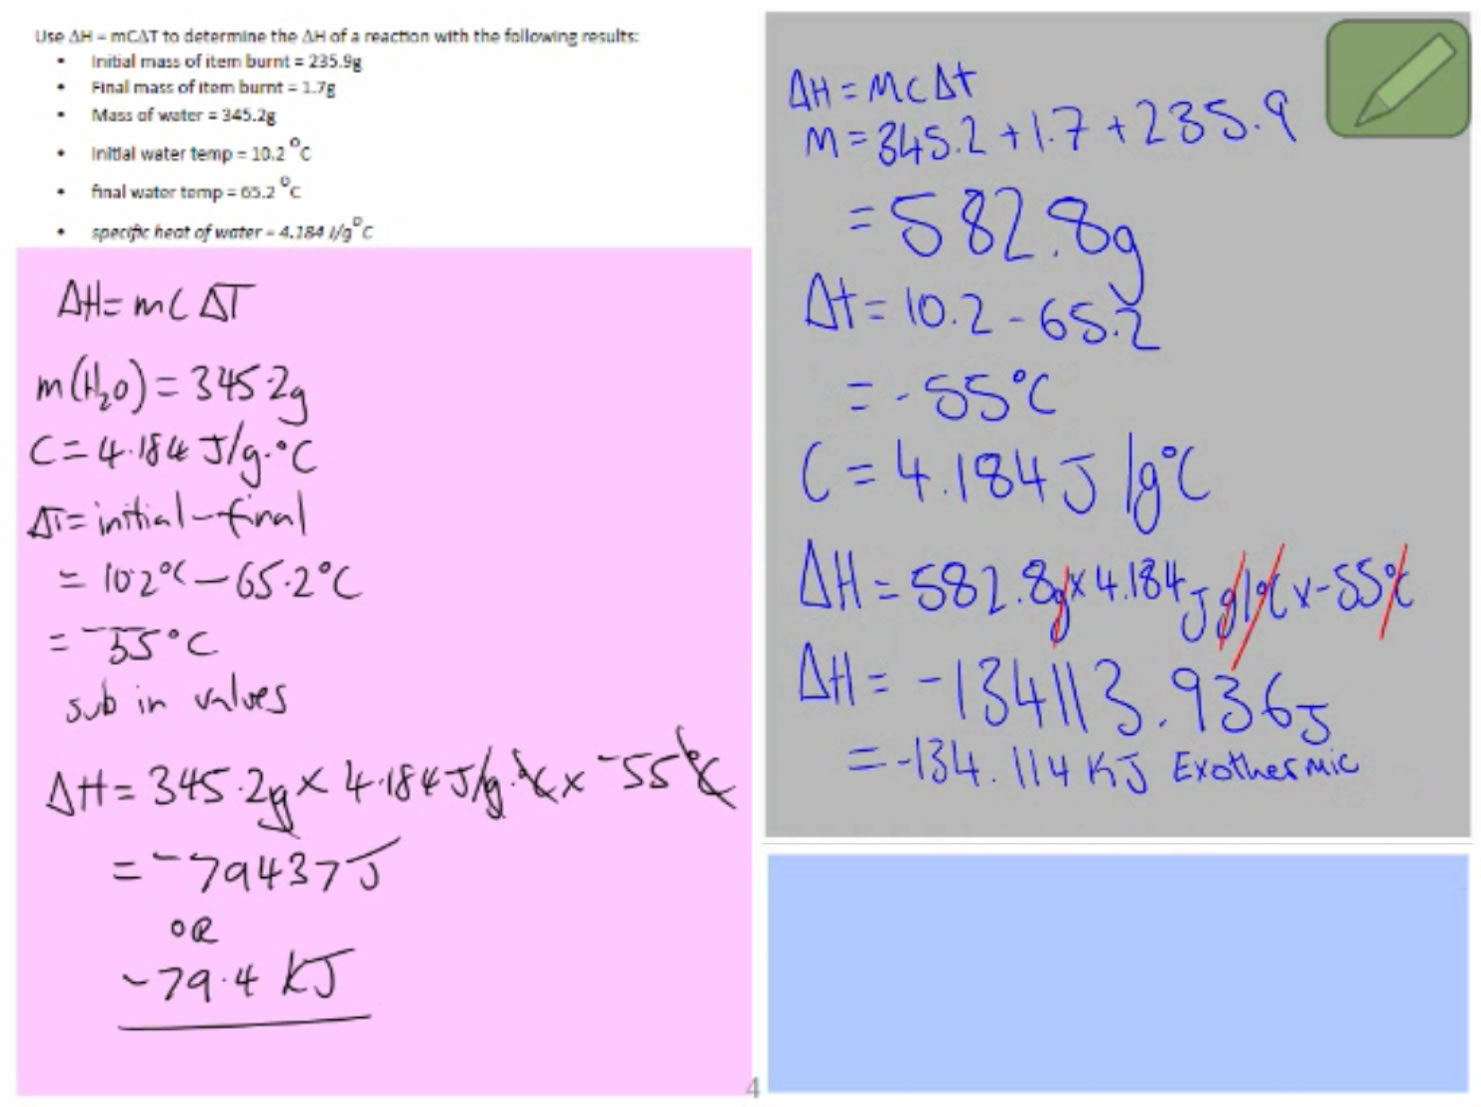
Interestingly, the student went and corrected their answer later on, which is a learning process in itself (although this was prior to my student failure to start and cutting room floor idea, so I’d be now encouraging the student to keep their original incorrect work for reference).

I’d love to see if this works for other teachers and learners – so please add a comment below if you try this and it works (or doesn’t!). I want everyone to be able to give this a go – so please feel free to download and use a zip file with all the icons from this link – CognitiveIcons.

Thanks for this post… It inspires me to get a bit more structure onto my notes and lectures within OneNote…
I wanted to ask you if I am allowed to use your icons or signs?
LikeLike
Hi Kurt – thanks for the feedback! Of course you can use the icons – I’m sorry if that wasn’t clear in the text, but that was why I made the zip file available for download. I’ll edit the blog entry and make sure that is clear! Please let me know how it goes using them. Regards. Matthew
LikeLiked by 1 person
[…] It prompted me to have another look at the templates in OneNote and not finding the one I wanted (traditional graph paper with every fifth line a slightly thicker), I set about making my own. I realised, that with templates, here was a perfect example of a technological tool that is a teaching timesaver. Having templates, organisers and backgrounds available at a stylus click means we can use the tools straight away – and reduce the cognitive load of both teachers and students. You can read more about my thoughts on images and reducing cognitive load in this article. […]
LikeLike
[…] showcased five ways he utilises Microsoft products in his lessons. One of these elements involved reducing the cognitive load for students through the use of symbols. Rather than having the same, long-winded instructions on […]
LikeLike
[…] Brisbane – Matt O'Brien here […]
LikeLike